Visuals have detailed 2 types of reports available:
- the Overview, that allows to compare performance between different content
- the Detailed Report, that allows to see in depth the performance analytics of one content
Overview
To Access the Login Visual Reports, you can select the All Reports page, then click on Login Visuals Stats.
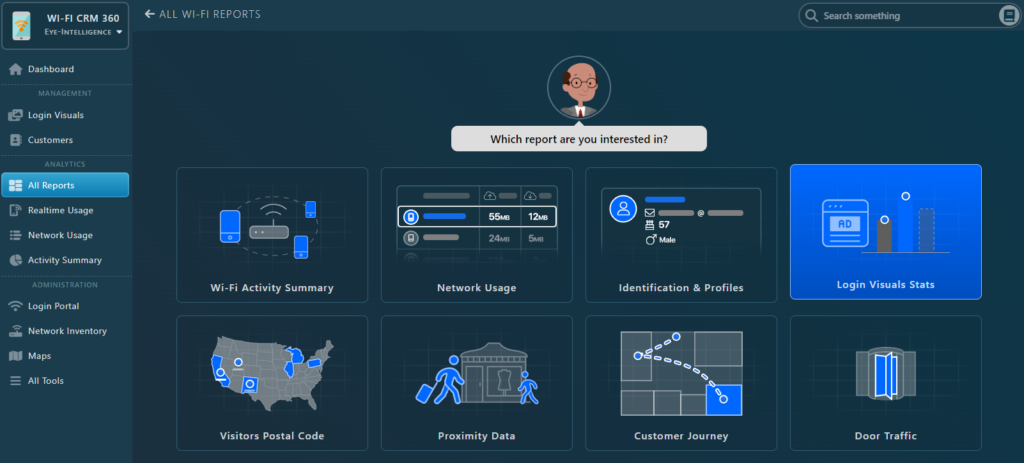
This will bring you directly to the Login Visual Reports that will load the period defined in your account preferences (by default 2 weeks).
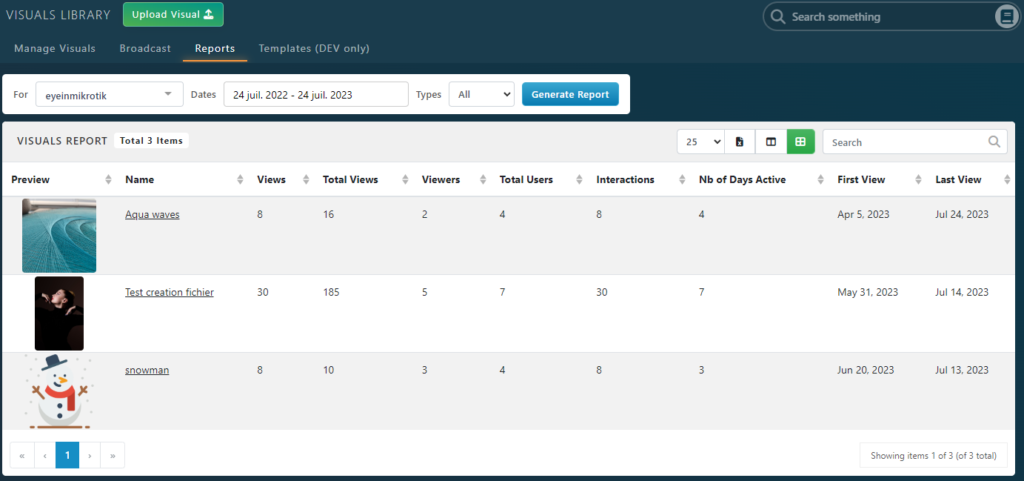
Note that you can sort all columns if you want by clicking on their name.
You can also click on one visual name to open it’s detailed page including the Detailed Report.
Report Options
If you can manage multiple Venues, you can select for which one you want to display the report in the For dropdown.
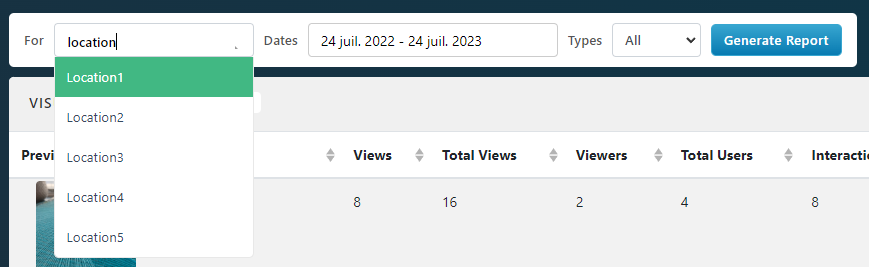
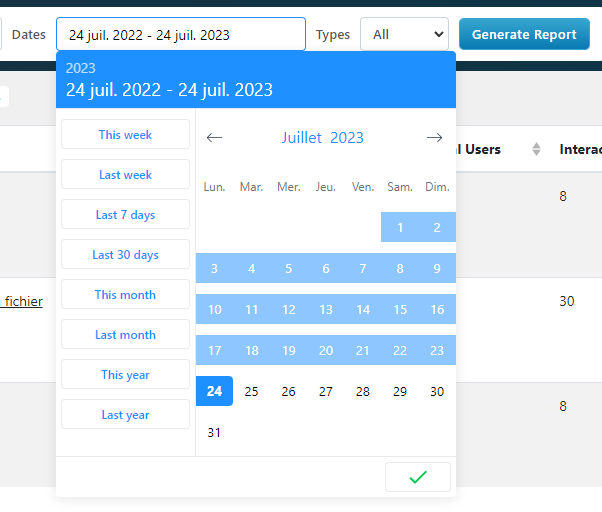
You can customize the dates of the report by clicking on the Dates dropdown. A few predefined ranges are available in the left columns.
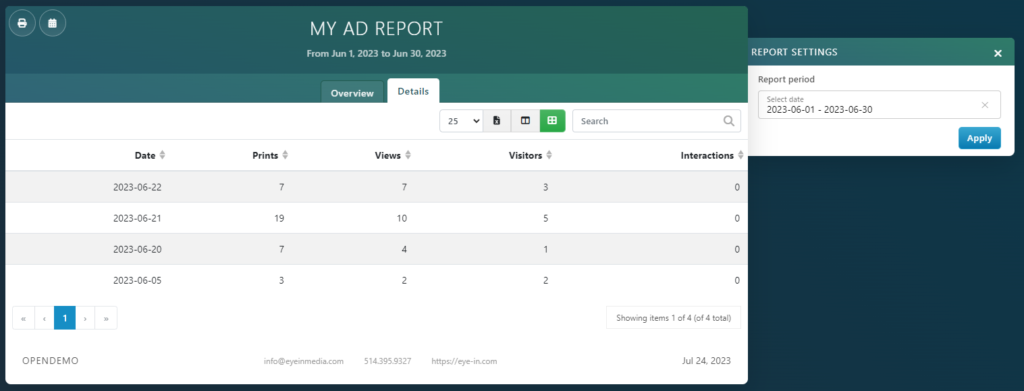
Visual Detailed Report
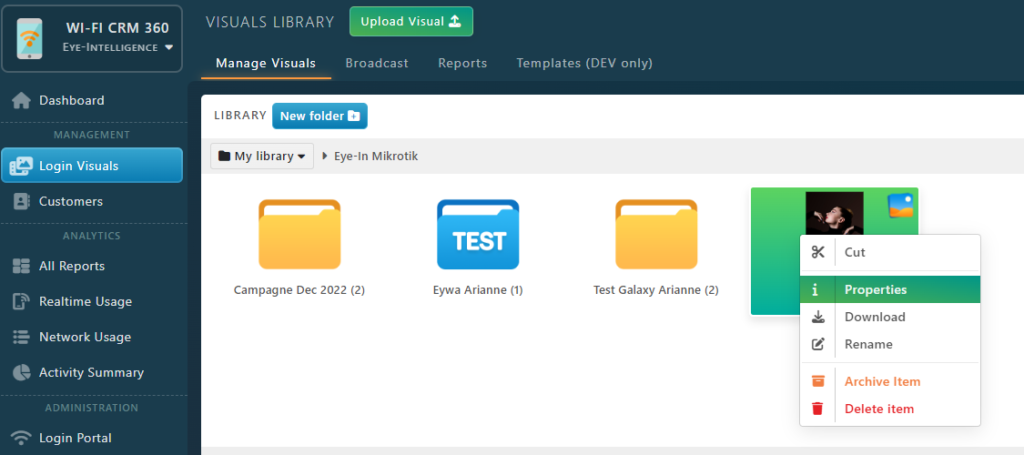
In the Login Visuals, you can also Open any Visual (Double click on it, or Right Click + Properties) to access it’s detailed page.
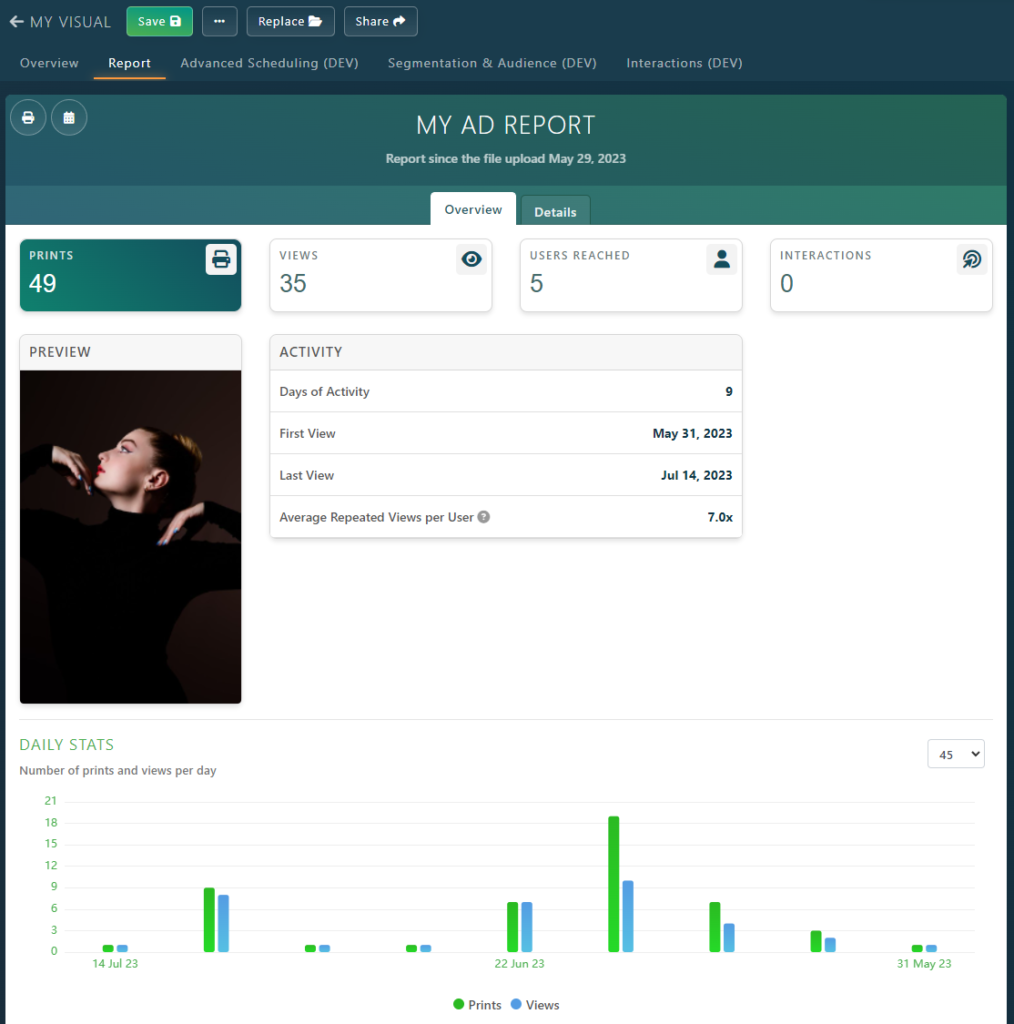
Select the Report Tab to display the detailed report.
In this report, you will have access to all detailed stats, including performance chart per day.
You can also list KPIs day by day by clicking on the Details Report Tab. From there you can sort by day, prints, or views to find which day was had the best performance!