The Wi-Fi dashboard is the main page when you arrive on the Wi-Fi CRM 360 Workspace.
It presents you right away with KPIs so you can find important metrics immediately. It also provides various shortcuts to quickly navigate where you want.
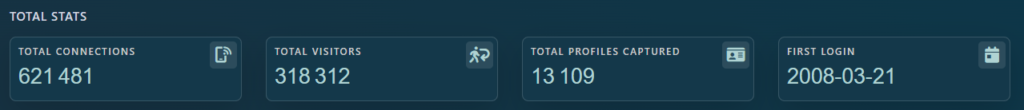
Total Stats
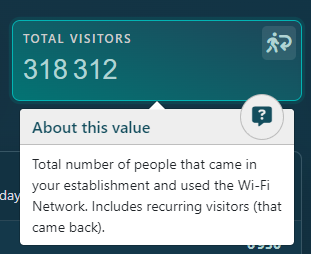
For all those KPIs, you can have a detailed description when you hover the value with your Cursor.
- The Total Connections is the Total number of Connections made by users to access Internet through your Wi-Fi Network. This is the total successfull count.
- The Total Visitors is the Total number of people that came in your establishment and used the Wi-Fi Network. Includes recurring visitors (that came back).
- The Total Profiles Captured is the Total number of Unique Profiles Captured on your Wi-Fi Network. The System builds profile to recognize your visitors when they come back.
- The First Login is the date of the first ever recorded Connection, so that you know how long it took to build all those KPIs
Recent Activity

All data below the Total Stats are linked to a Recent Period of time defined in your Dashboard Preferences. The period is detailed on the right of the Recent Activity or Below on Mobile
The duration of the period is also reminded in most Dashboard Card.
Activity Summary
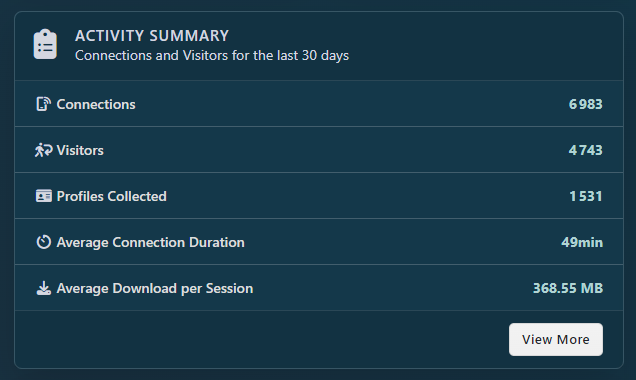
As its name implies, the Activity summary shows an overview of the activity on your Wi-Fi Network for the Recent. Metrics are the same as described for the Total Stats.
Click on the View More button to open the Complete Activity Summary Report.
Top 3 Visuals
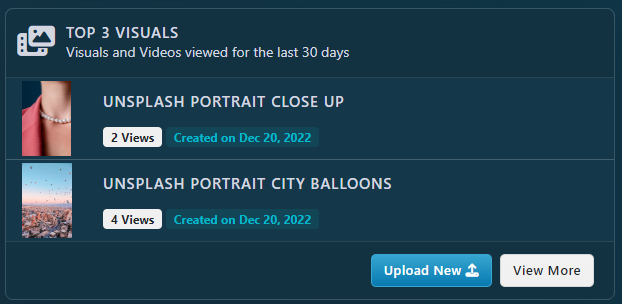
This Widget is for Marketers to quickly find the best performant Visuals broadcasted through the Login Portal.
If you don’t see any visual in here it means you don’t have any running visual, and you are losing marketing opportunity.
Click on the Upload New button to quickly add a new Visual to your Login Visuals Library.
Click on the View More button to open the Login Visual Report.
Per Day – Chart
This Chart details how many connections you had per each day.
Note that this chart is interactive and you can hover any bar to view the exact value.
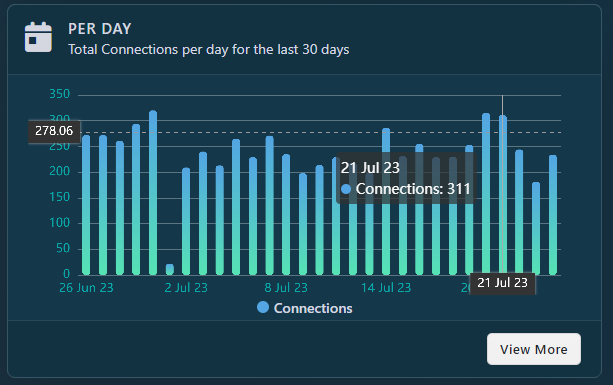
Click on the View More button to open the Complete Activity Summary Report.
Today – Chart
This Chart represent the Activity since the beginning of the day. It’s particularly useful to monitor the usage and make sure there is no configuration or power issue.
Note that this chart is interactive and you can hover any bar to view the exact value.
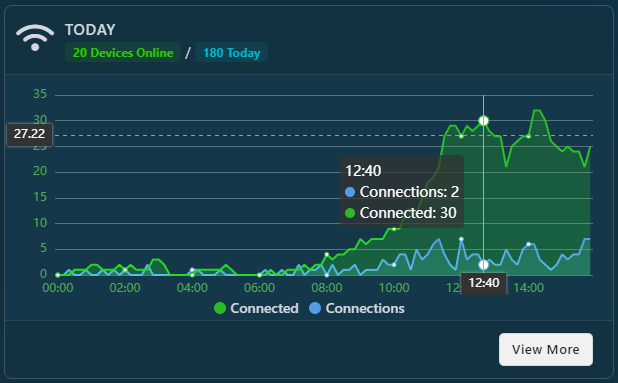
Click on the View More button to open the Realtime Usage Report, which will list who is Online right now.
Additional Widgets
The next widgets are only available for certain Network Controllers. Contact your Account Manager for more information.
Proximity Data – Chart
The Proximity Data provides a quick overview of Data gathered with those who were detected nearby the network.
Note that this chart is interactive and you can hover any bar to view the exact value.
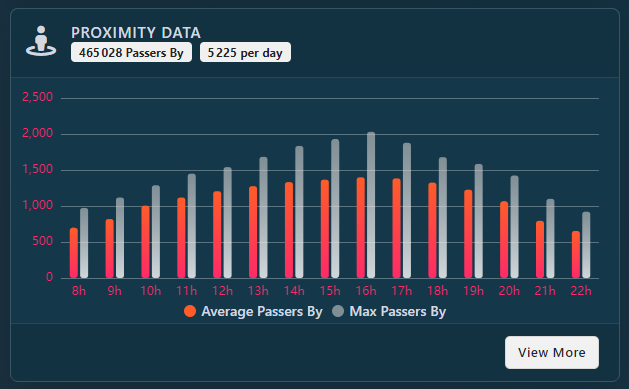
Click on the View More button to open the Complete Proximity Data Report which also features heatmap and per Access Point proximity mapping.
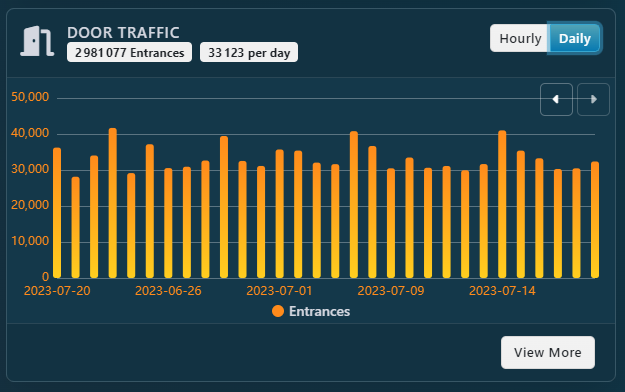
Door Traffic – Chart
The Door Traffic Chart shows the number of entrances and exists registered with Door Counters. It is available to present the data Hour by Hour, or Day by Day.
Note that this chart is interactive and you can hover any bar to view the exact value.
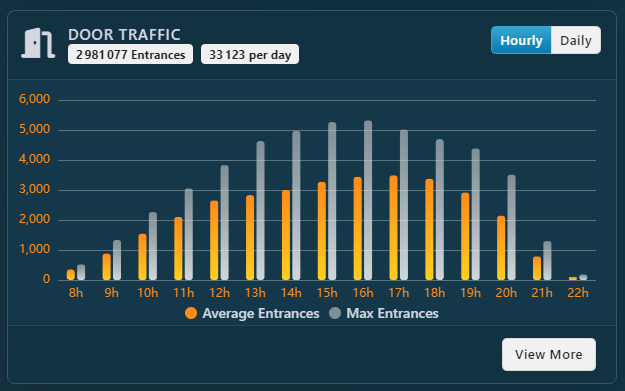
Click on the View More button to open the Complete Door Traffic Report.
The same report Day by Day