Select the Activity tab to view all agent activities:
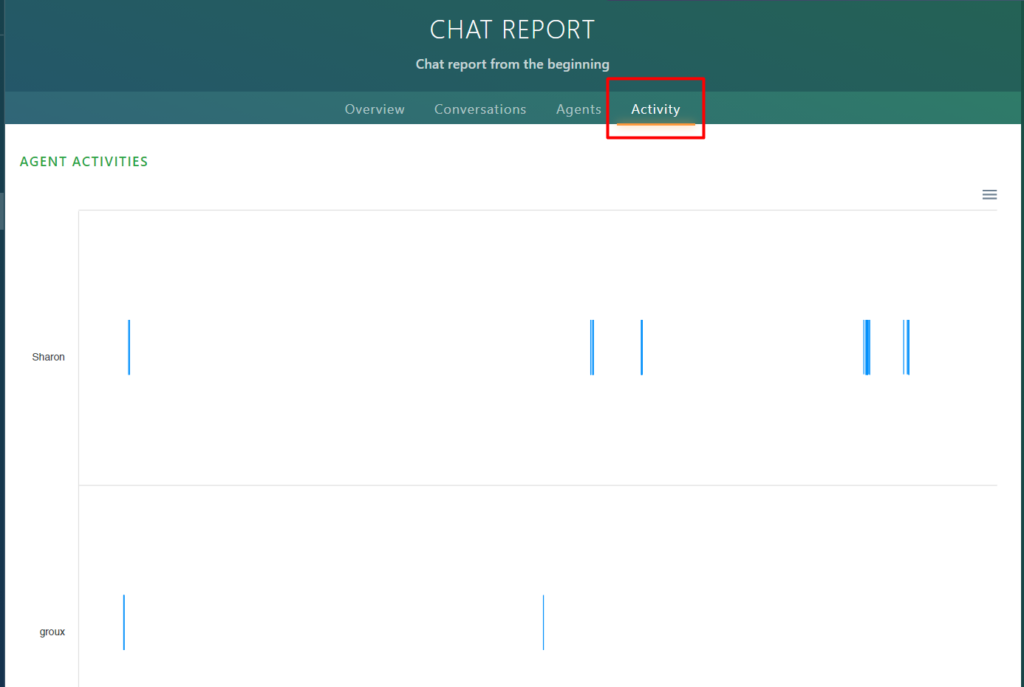
Analyzing the graphs
On the bottom of the graph, you can see the dates:
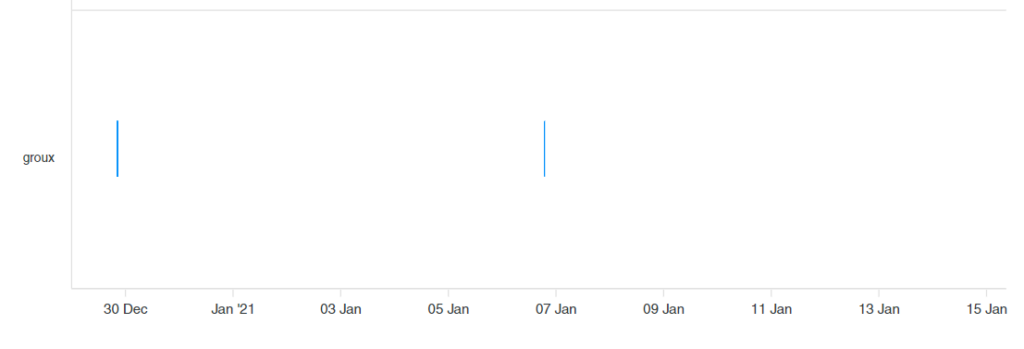
The blue lines correspond to the times that the agent was connected.
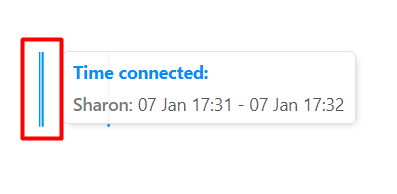
If you hover over a line, you can see the date and time that the agent was connected:
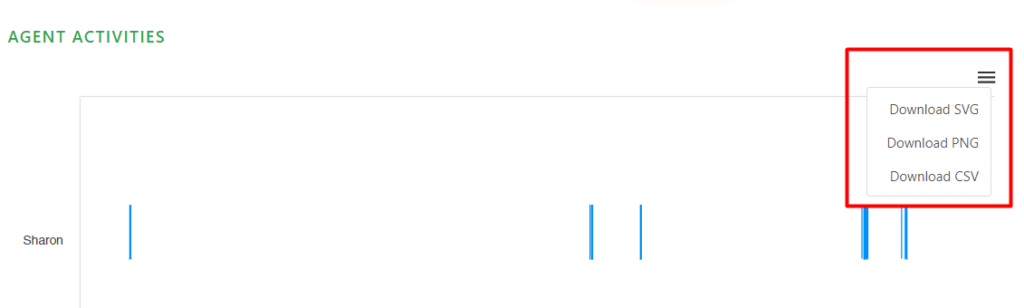
Exporting the graphs
If you click on the right drop-down menu, you can download the graphs in SVG, PNG, and CSV formats.