In the Overview section, you can see data such as:
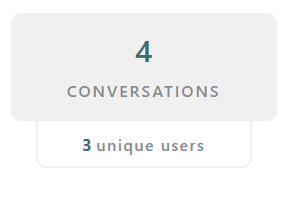
- The total number of conversations, with the number of unique users (meaning first-time users who have not used chat before)
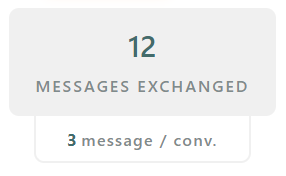
- The number of messages exchanged with the average number of messages per conversation
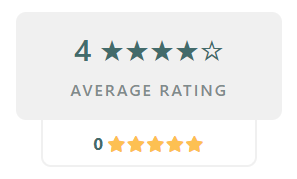
- The average rating, and right underneath it, the number of 5-star ratings
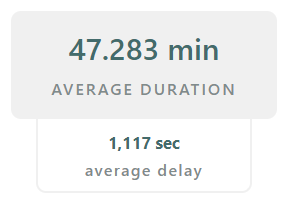
- The average duration for a conversation and the average delay between messages
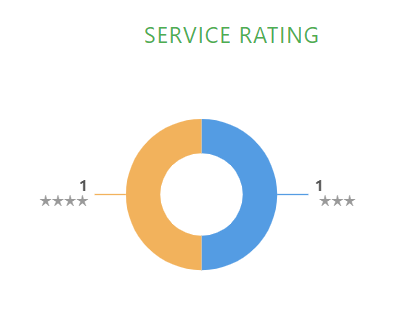
Underneath this information, you can find pie charts that display:
- The service rating
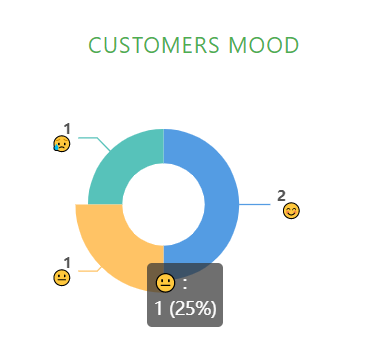
- The customers’ mood during the conversation
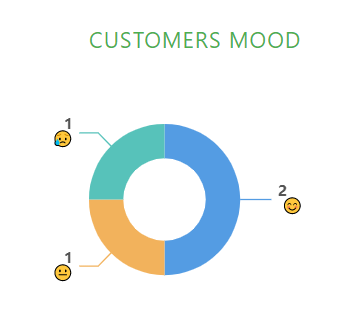
You can hover over the sections of the pie chart to see the percentages, like this:
Under the pie charts, there are 2 more graphs:
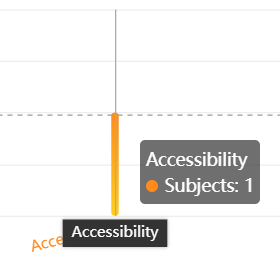
- Subjects: shows subject matter of the conversations:

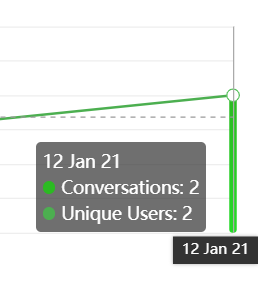
- Conversations: shows number of conversations using chat: