To see statistics about everything, click Reports tab
How to select the Report Period
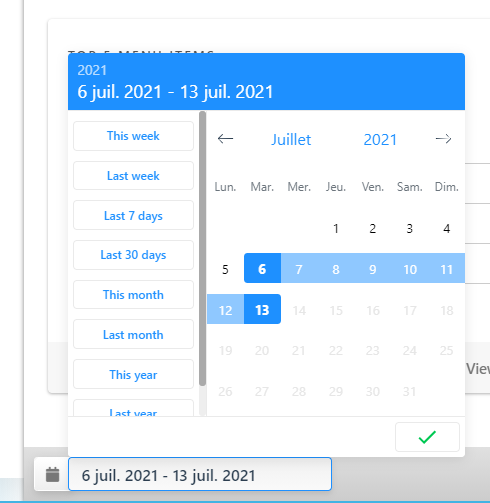
Select one of the following:
- This week: data for Monday to the current date
- Last week: data for Monday to Sunday of the previous calendar week
- Last 7 days
- Last 30 days
- This month
- Last month
- This year
- Last year
Custom date range
To select a single date:
- Click on any date on the calendar
To select a range of dates:
- Click the desired start date, then click the end date. The selected data are highlighted
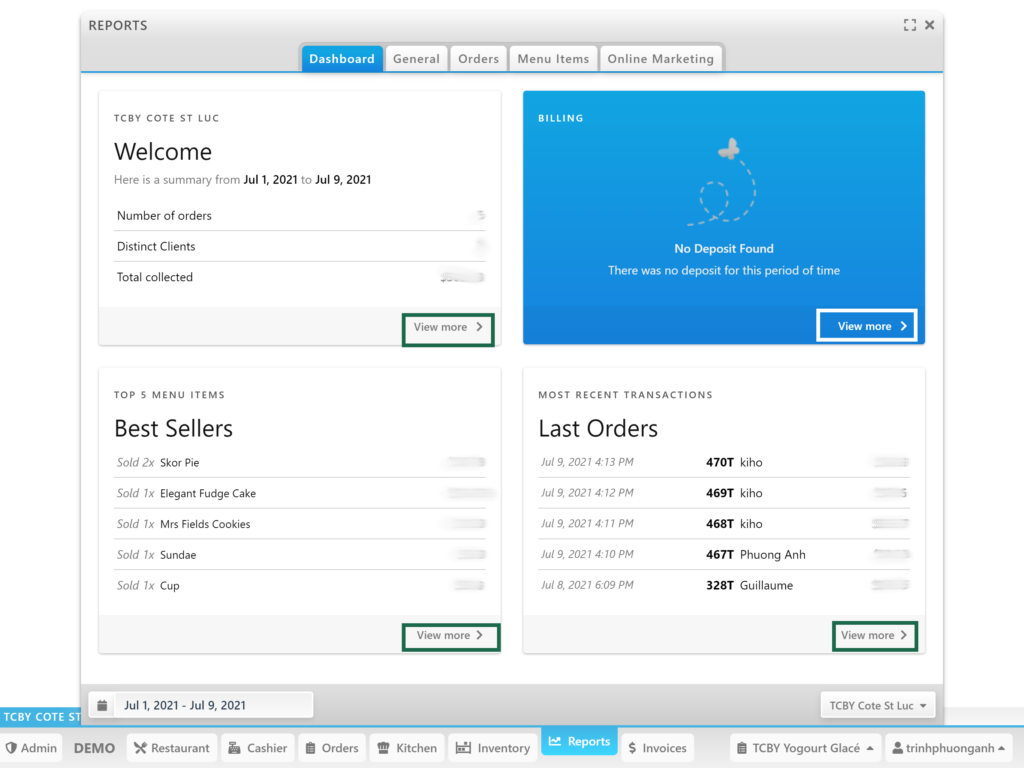
Dashboard
The dashboard is the overview of the statistics. Everything will be there as a summary.
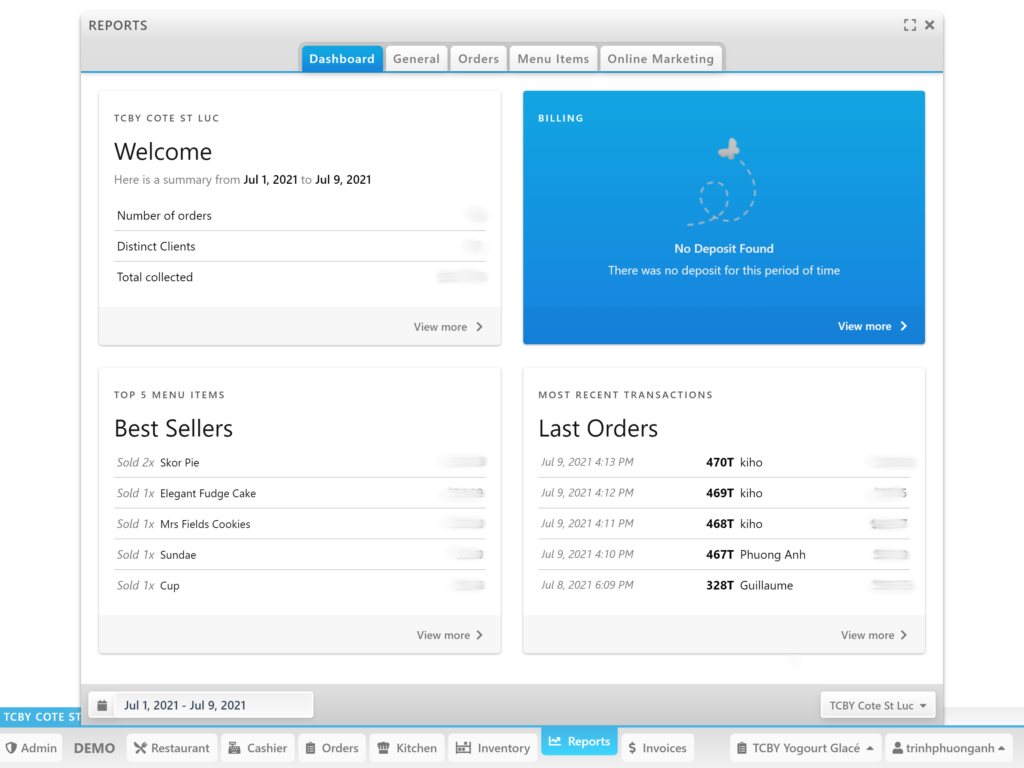
Click View more to see more details.
Statistics of specific date/week/month can be seen by choosing it in the calendar.
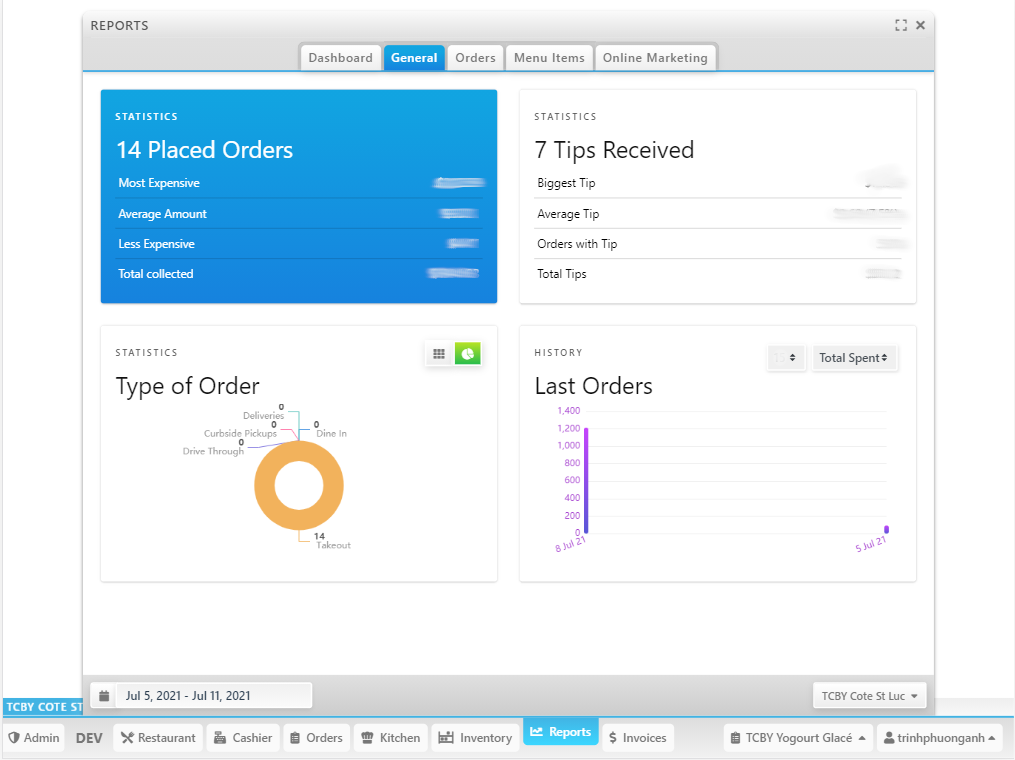
General
General tab is the statistics of restaurants’ sale. Restaurant could see:
- how many orders were placed (how much is for the most/average/less expensive order and total collected from all the orders)
- what type of orders (percentage of takeout/dine-in/curbside pickups/deliveries/drive-through orders)
- how many tips that the restaurant received
- histograms of last orders’ total spent/customers/orders
Statistics of specific date/week/month can be seen by choosing it in the calendar.
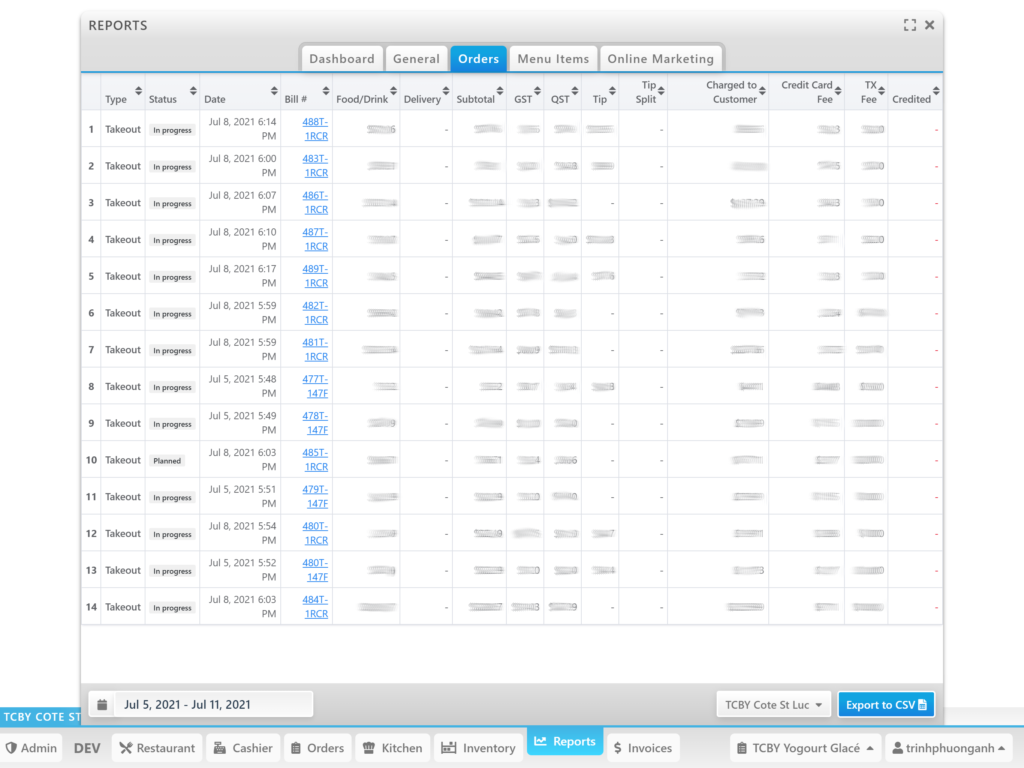
Orders
Orders tab is where to see all the details of orders in the form of a table that can be exported to CSV file.
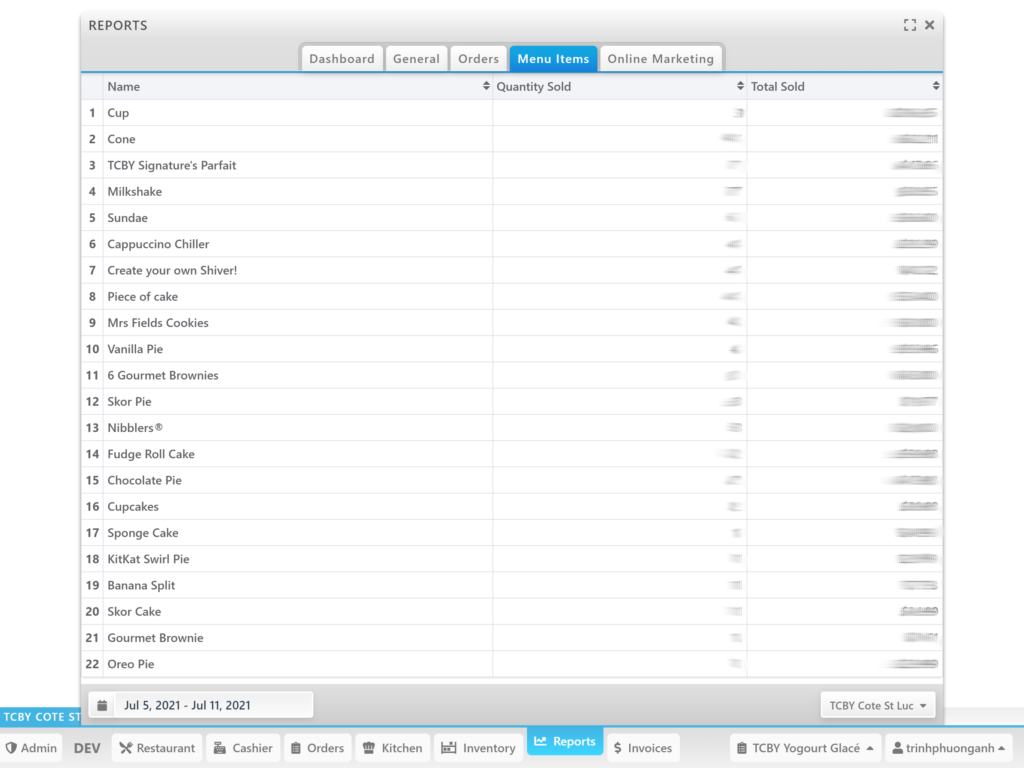
Menu Items
To see which items are sold as well as their sold quantity and how much money spent from them, click Menu Items tab.
Statistics of specific date/week/month can be seen by choosing it in the calendar.
Online Marketing
This tab is for statistics of marketing campaigns if the restaurant has any. It will show the source of the orders (based on links directing users to the restaurant’s menu and where the orders are made)